Overview
This document is intended to guide you in understanding and using the File IQ dashboards to their full capabilities. Each section contains a detailed description of the dashboard, an explanation of the filters, and a use case for the dashboard.
Note: The screenshots included in this document display very low figures because we used a small dataset. Real-world usage would yield significantly higher metrics.
Note: The screenshots below display a Grafana instance using the dark UI theme. To change this theme, see the Grafana documentation.
Note: Data and chart information is based upon the criteria and timeframes selected.
Accessing Nasuni Dashboards
To access the File IQ Grafana homepage, navigate to the URL of your Grafana instance. The URL is similar to https://xx.xx.xx.xx:3000/, bringing you to the File IQ login page.
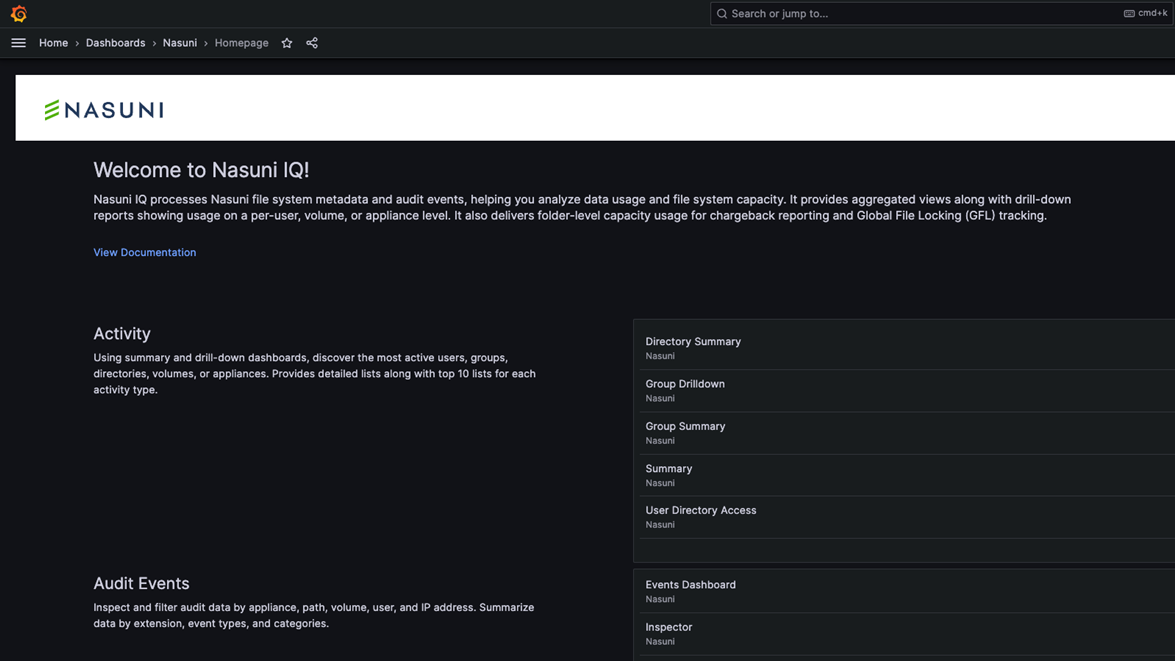
After logging in, the File IQ Dashboards homepage appears, showing a list of available dashboards grouped by data type.
Homepage
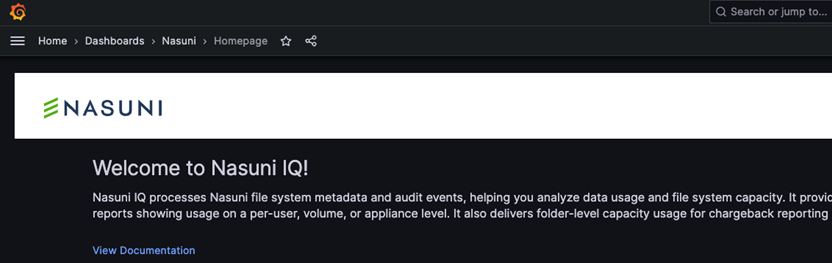
To navigate back to the homepage, click Home or the Grafana logo in the top left corner of the screen.
Dashboards
To view the complete list of available dashboards, click the burger menu ☰ in the top left corner and click Dashboards.
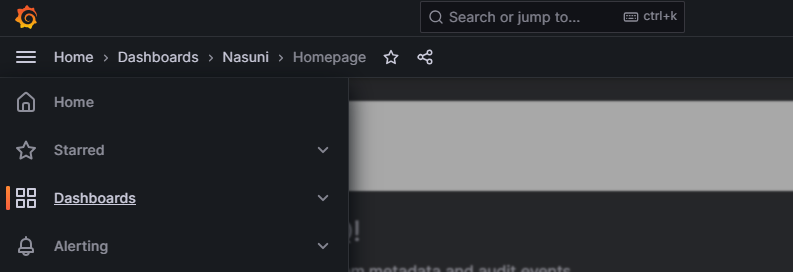
In the Dashboards menu, a list of available dashboards is displayed under the Nasuni folder.
.png)
Key Terms
The following terms are helpful in understanding the File IQ Appliance:
Activity: This describes when a user performs an operation, such as reading a file, editing a file, or deleting a file, on a volume that is configured for File IQ analytics.
Child Directory: Any directory contained within another directory (a nested directory). When a count of child directories occurs, the count also includes “.” which is the current directory. This also includes hidden directories.
Child File: All the files within a directory, including hidden files.
CRUD: This acronym stands for create, read, update, and delete. It represents the four basic functions of persistent storage in a database.
Directory Size: The current uncompressed cloud size of the directory.
Event: As activity happens, events are generated and sent to the FILE IQ. These activities are displayed on the dashboards.
Event Categories: Categories of events that contain event types. See Event Categories and Types.
Event Types: Types of events, such as creating the file, changing the owner, and renaming the file. Event types are aggregated throughout the File IQ dashboards.
Extensions: The suffix at the end of each file name that indicates the file’s format or the type of data it contains. For example, .txt, .pdf and .docx. There are 500 supported extensions shown on the dashboards; all other extensions are categorized as [Other]. The supported extensions list can be seen in the appendix. The Inspector dashboard displays every extension, regardless of whether it is supported.
File Size: The current cloud size of the file.
FSMS (File System Metadata Service): The FILE IQ service that scans volumes for metadata. Volume scans happen once a day.
Dashboard Functionality
The following section describes commonly used dashboard functionality.
Time Range Controls
FILE IQ dashboards have a time picker for controlling the time range. The time picker shows the selected time range displayed on the FILE IQ dashboard.
Hover over the time picker to view the exact time range and time zone.
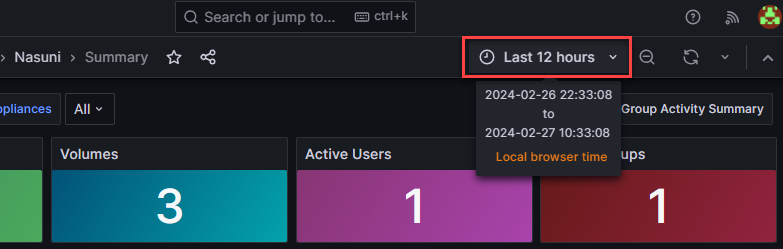
Use the time picker to select a relative time, such as “Last 3 hours”, or an absolute time range, such as 2024-02-14 09:00:00 to 2024-02-14 13:00:00.
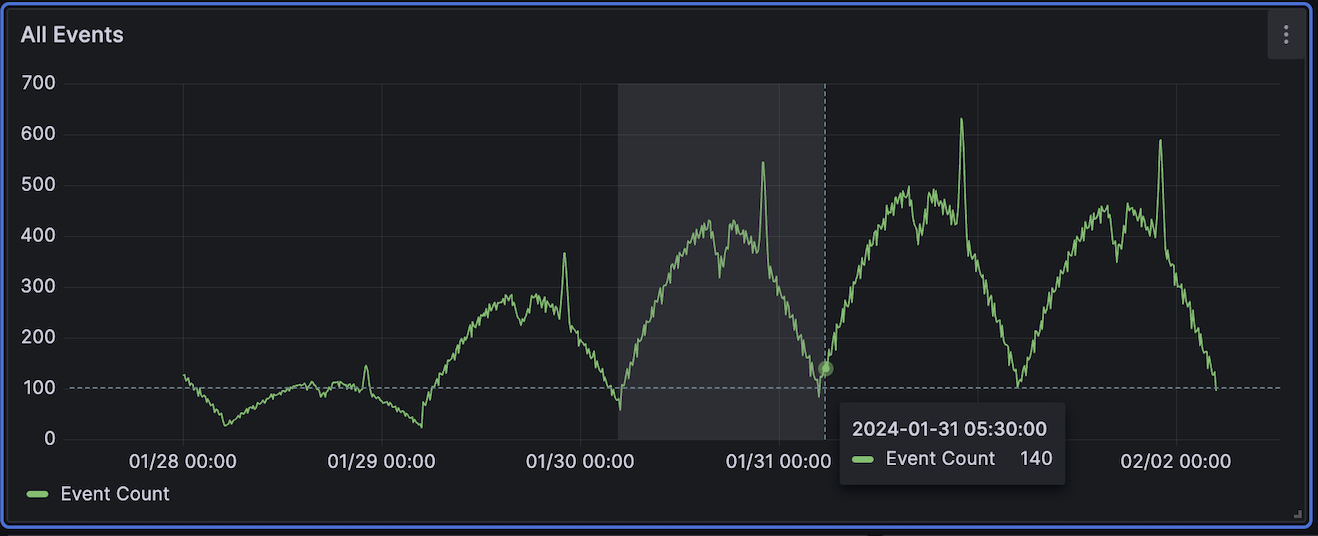
Click the zoom-out icon to the right of the time picker to view a larger time range. When viewing a graph, click and drag a range to zoom into that time range.
Note: The time picker is only visible on dashboards that use time as a search parameter.
Filters
Most FILE IQ dashboards have filters located at the top of the page. The two types of filters used are as follows:
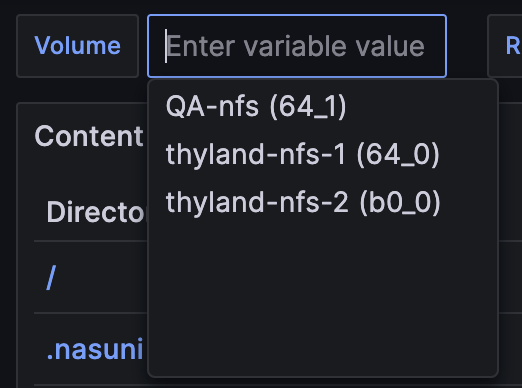
Dropdown Filters: These filters display a list of options when expanded. There are two versions of these filters:
Single select dropdown: Only one filter option can be selected.
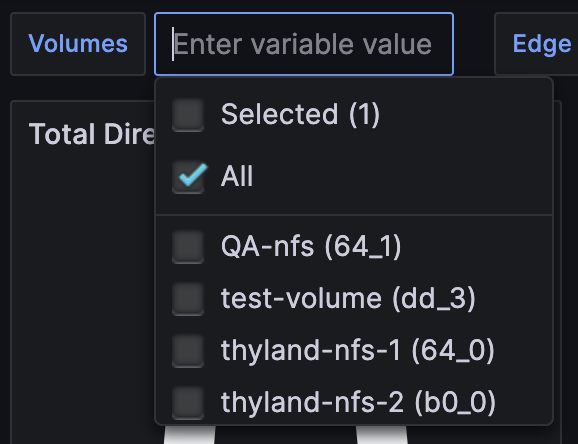
Multiple Select Dropdown: Use this selector to filter based on all or multiple individual options in the dropdown.
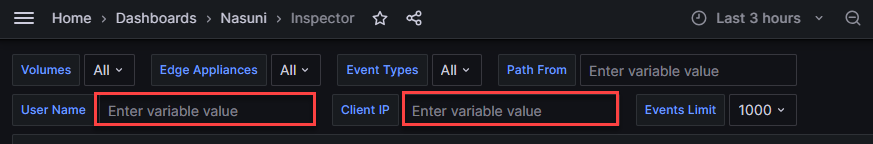
Textbox filter: This filter displays an empty text box and filters a field based on input.
Export to CSV
All File IQ Dashboard panel data is exportable to CSV format.
To export panel data, follow these steps:
Hover the top right-hand corner of a panel to display the menu.
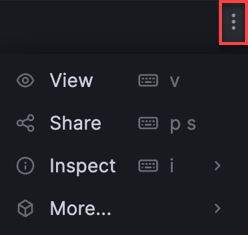
Select Inspect > Data. A Data options dialog box displays.
(Optional) Toggle on Download for Excel to add headers to the CSV for use with Excel.
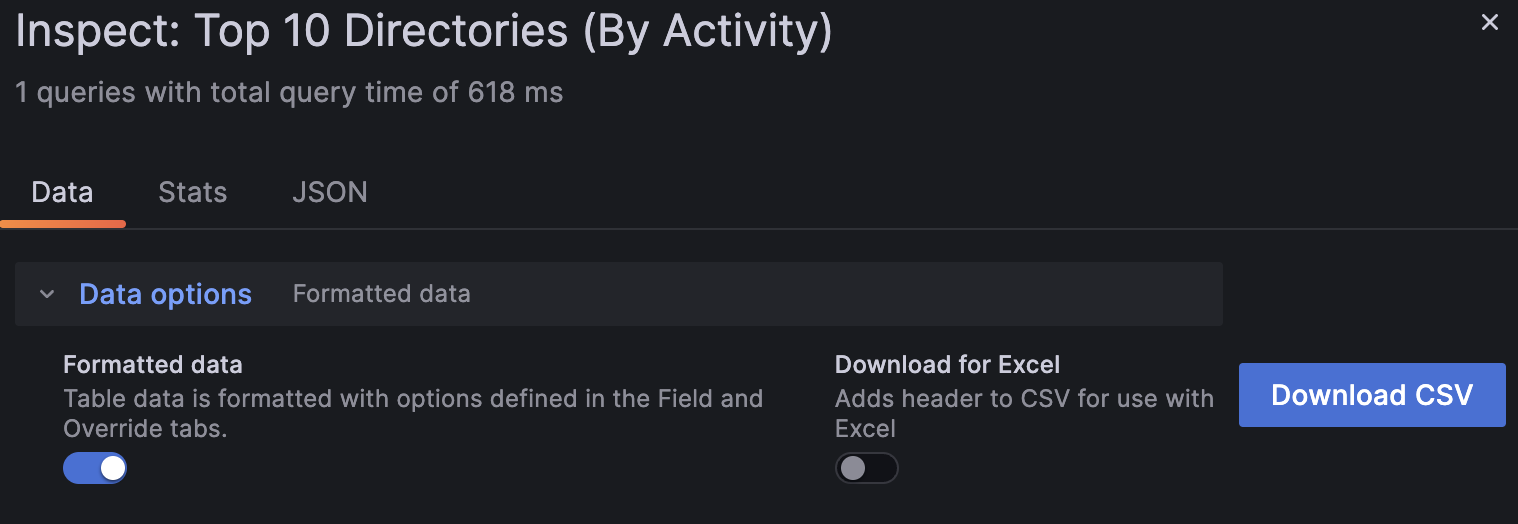
Click Download CSV to finish.
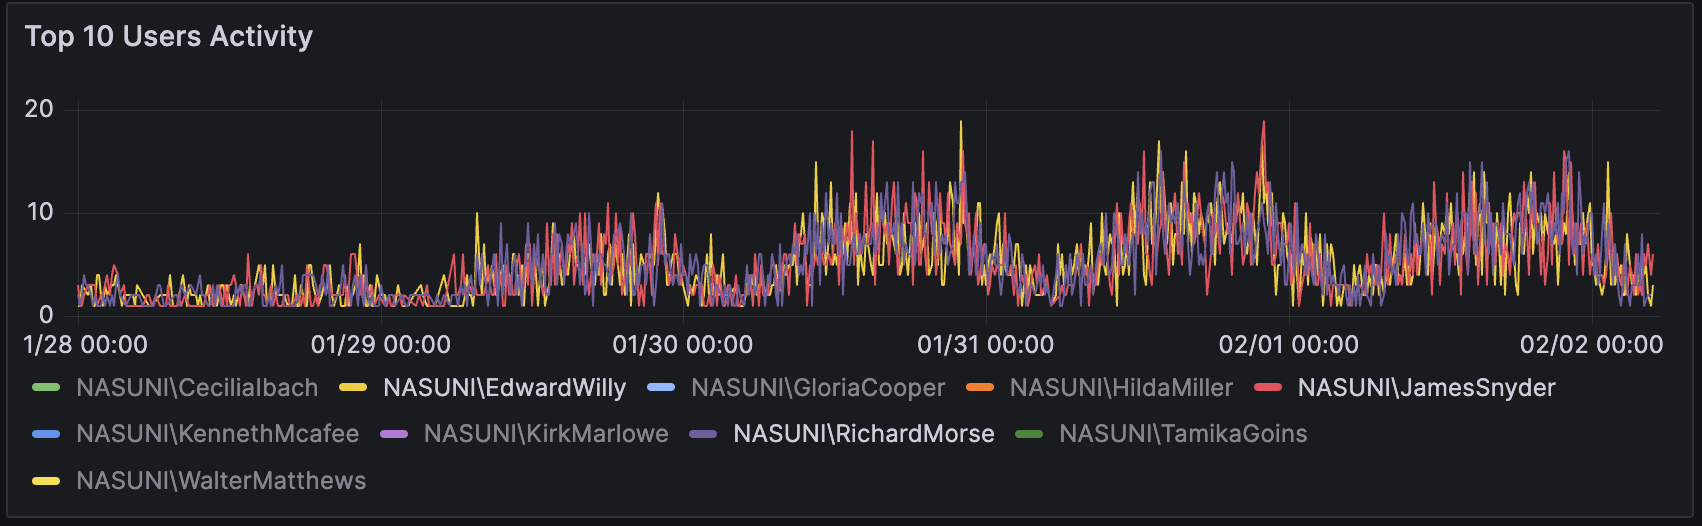
Time Series Panel
Time series panels are used throughout the dashboards—for example, the Summary dashboard's Top 10 Users Activity panel.
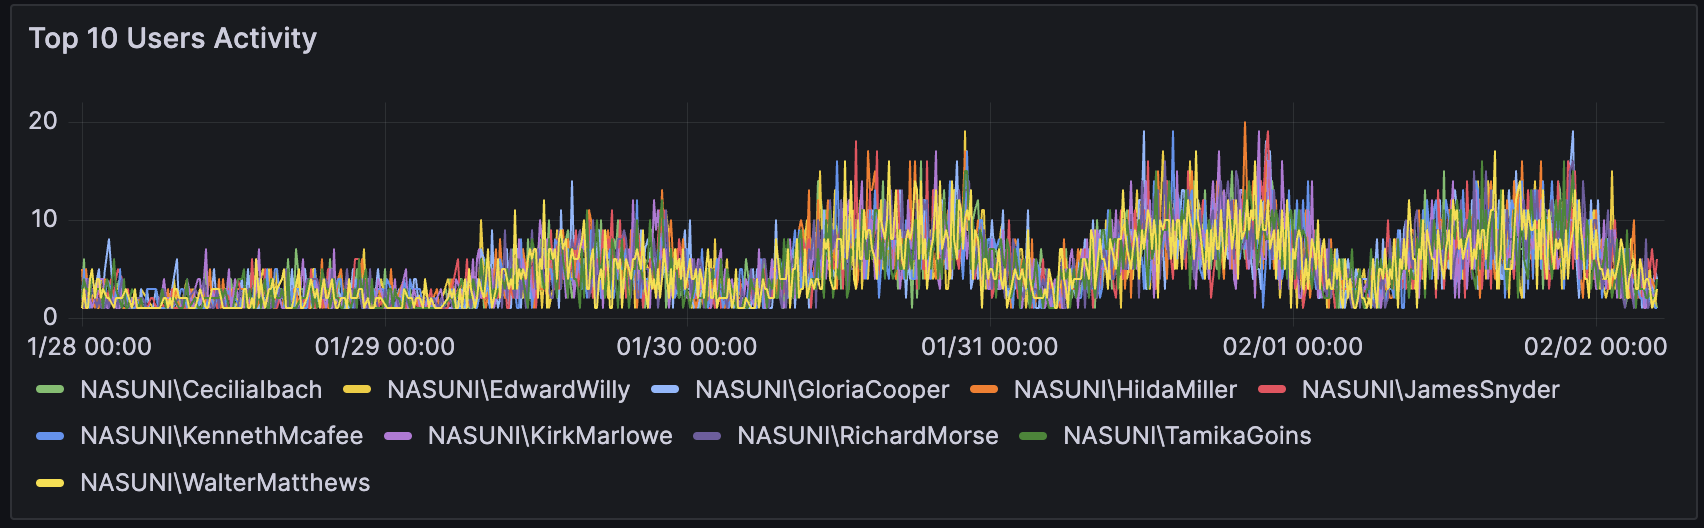
At the bottom of this panel, a legend displays the names of each of the top ten users. If you select one of the names, the graph shows only data relevant to that user. To select multiple names, hold Shift and click each name.
Pie Chart Panel
Pie chart panels are used throughout the dashboards – for example, the Events Dashboard Top Folders panel.
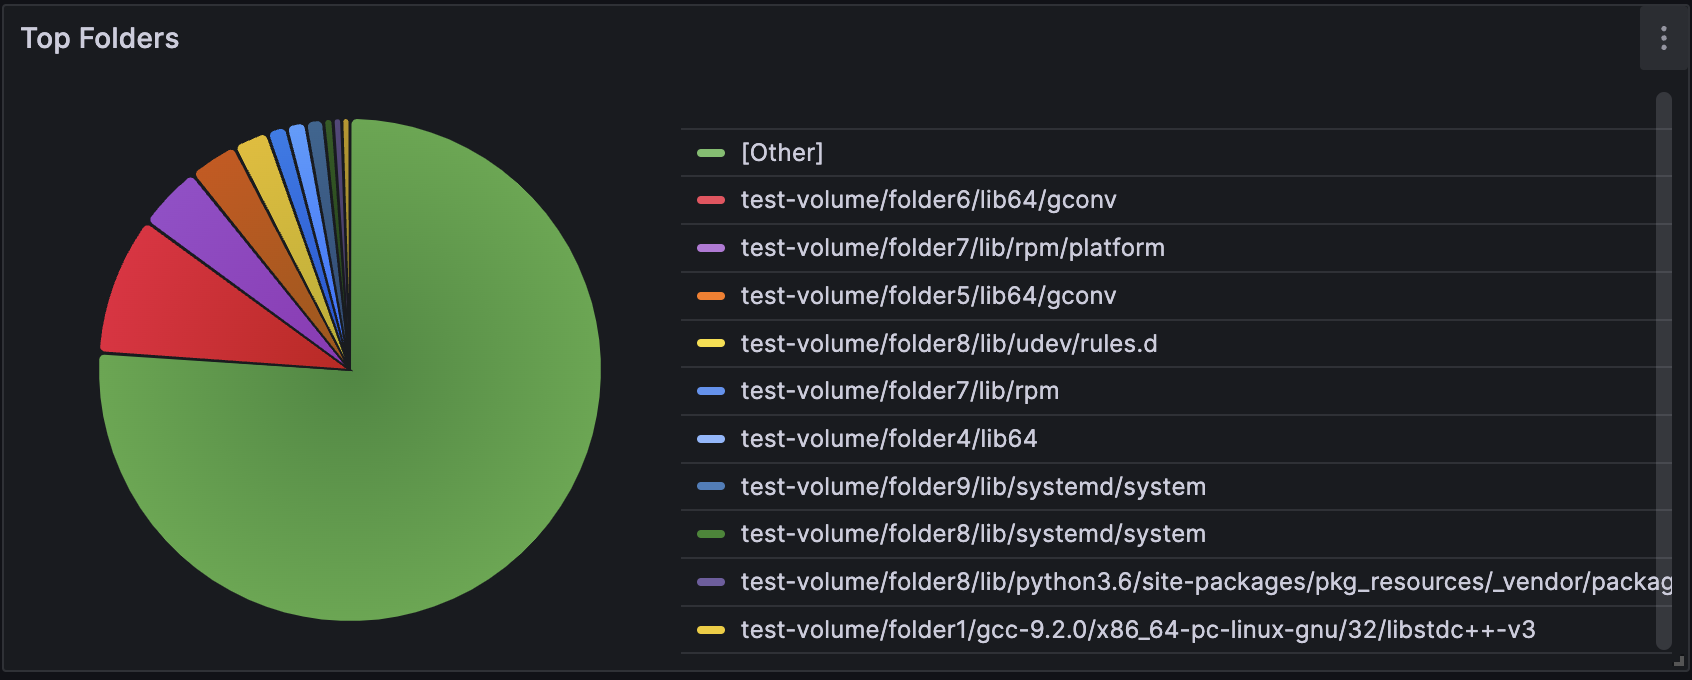
The legend displays the paths of each of the top ten folders, and the [Other] line represents the rest of the volume data.
Pie chart legends work the opposite of time series legends. Clicking an option in the legend removes that option from the pie chart. For example, clicking [Other] removes that section of the pie chart and redistributes the other sections as appropriate.
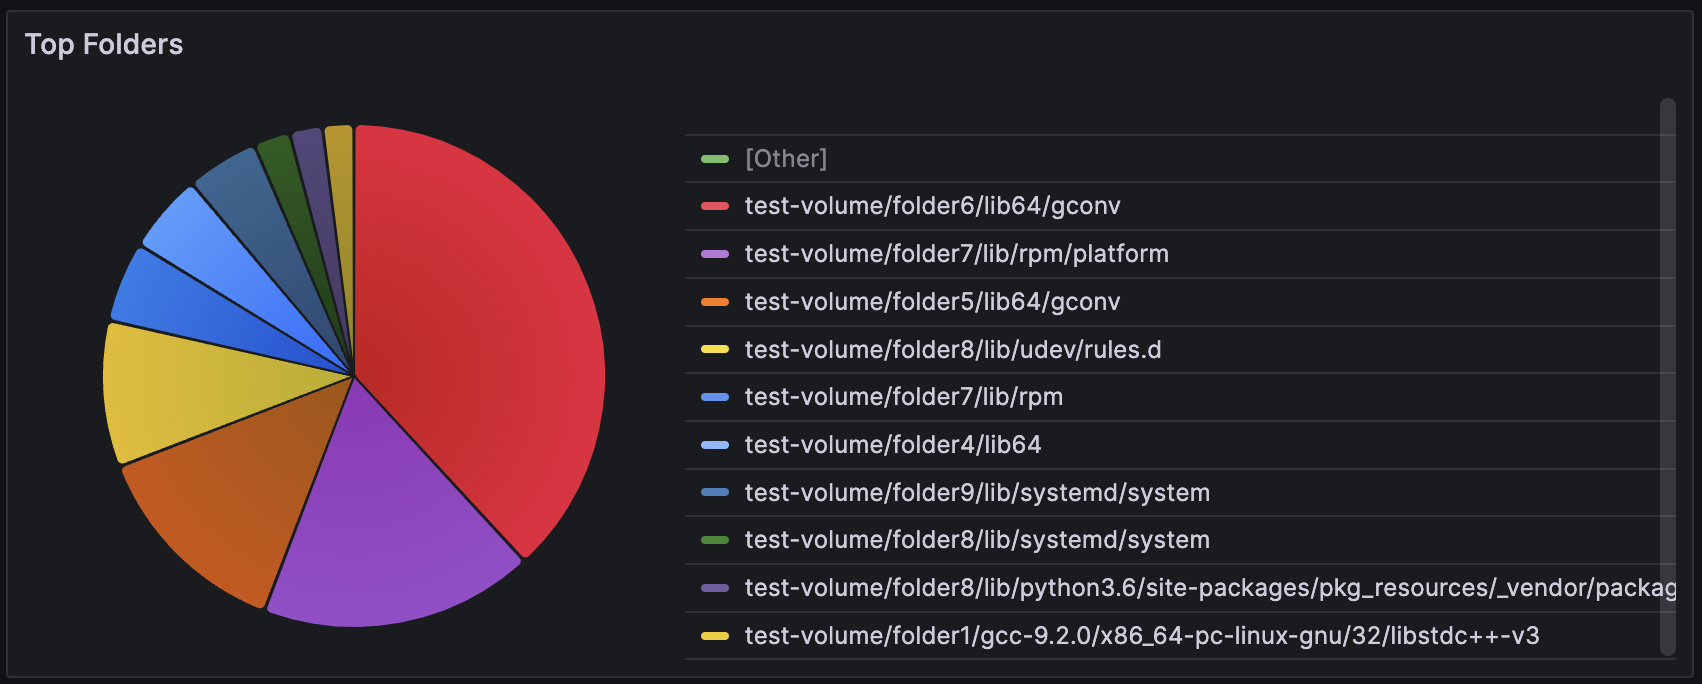
Table Panels
Table panels are used throughout the dashboards: for example, the Directory Summary dashboard’s 10 Most Active Directories panel. These headers are sorted by Ops in descending order. If you click another header, the table resorts based on that table header.
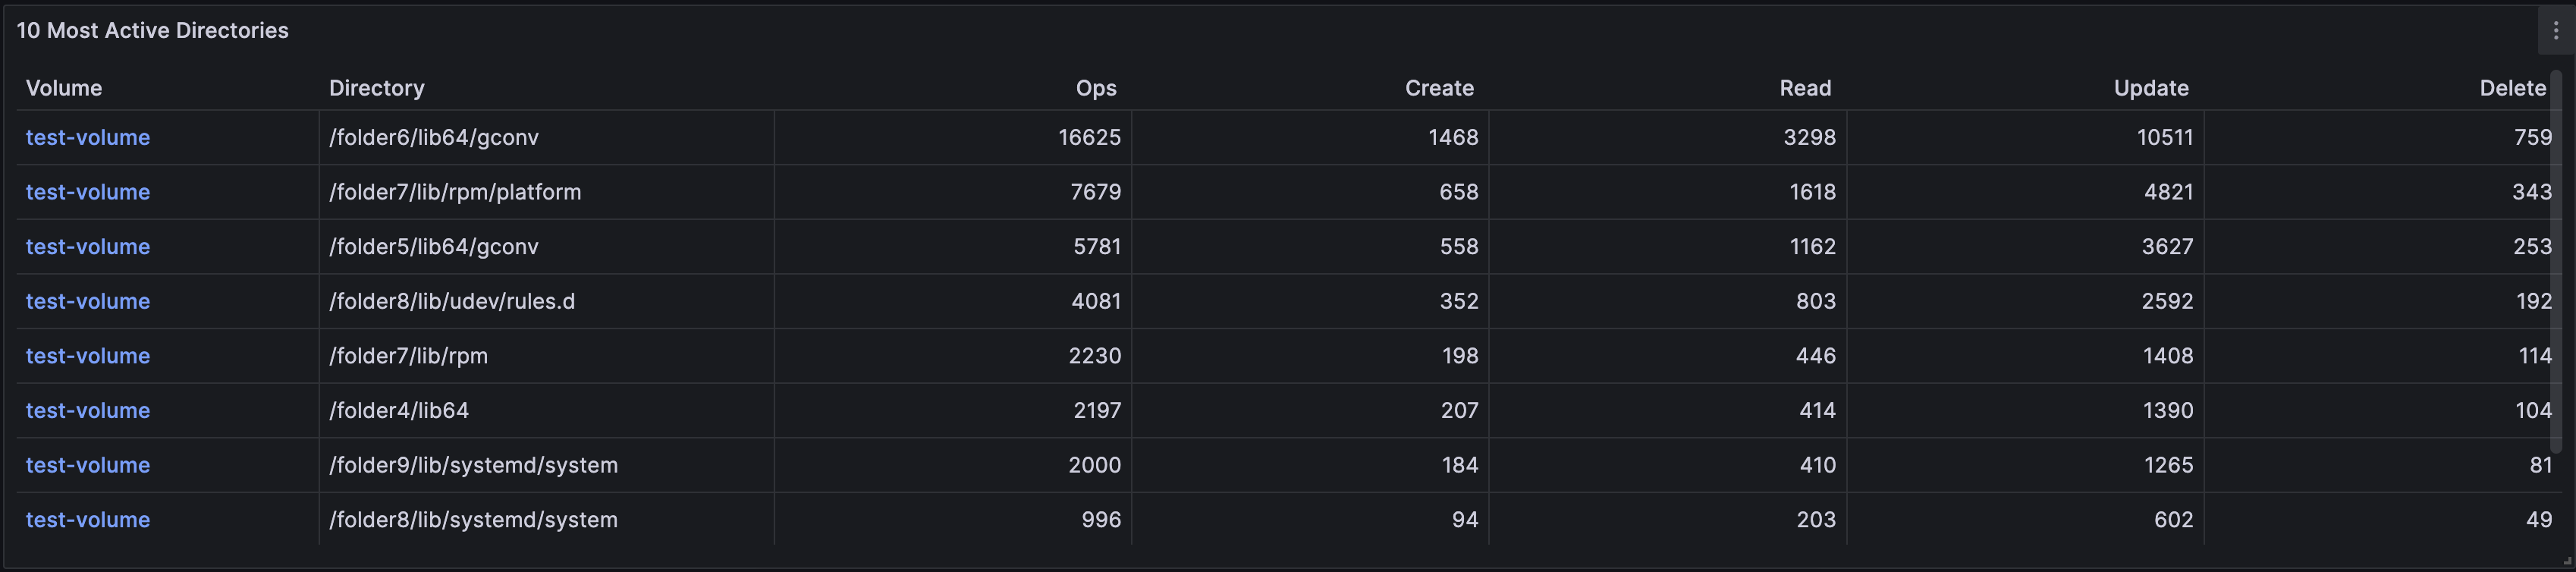
Note: Only one table header can be sorted at a time.
File IQ Dashboards Overview
Nasuni File IQ Dashboards are categorized by their primary function. These functions include activity, audit events, metadata, visibility, and reporting.
Note: The following File IQ Dashboards are included in the Basic license unless indicated as a Premium Dashboard.
Activity
Using summary and drill-down dashboards, you can discover the most active users, groups, directories, volumes, or appliances. These dashboards provide detailed lists and top 10 lists for each activity type.
View activity using these dashboards:
Directory Summary
Group Drilldown
Group Summary
Summary
User Directory Access - Premium Dashboard
Audit Events
You can inspect and filter audit data by appliance, path, volume, user, and IP address. These dashboards summarize data by extension, event types, and categories.
View audit information using these dashboards:
Events Dashboard
Inspector
Metadata
These dashboards aggregate file system metadata for volumes to provide top-level and subfolder capacity and counts for chargeback reporting. You can instantly visualize your directory tree using size-driven rectangular treemap views. You can observe where Global File Lock (GFL) is used, along with the associated file count and capacity.
View metadata using these dashboards:
Global File Lock Directories - Premium Dashboard
Volume Explorer - Premium Dashboard
Volume Stats - Premium Dashboard
Volume Usage
Volume Utilization - Premium Dashboard
Volumes Summary
Visibility
These dashboards provide insights into the background processing of the File IQ Appliance. You can gain an understanding of when your Volumes are scanned and which NEAs are currently communicating with your File IQ appliance. The dashboard also provides detailed diagnostic information from the database.
View visibility information using these dashboards:
Database Support
Service Support
System Status
Reporting
Download Nasuni File IQ reports and view report execution history.
View reporting information using the following dashboard:
Report History - Premium Dashboard